By Bob Van Veldhuizen
The evaluation of any new agronomic crop species or variety that might be suitable for production in the Alaska environment is done in replicated variety trials at the Matanuska Experiment Farm and Extension Center (southcentral) and the Fairbanks Experiment Farm (interior). The studies ask if this potential new crop or variety can be planted as seed early in the spring (early to mid-May) and produce a crop with high yields and high quality at harvest by early to mid-September? These trials are done at both locations to see if the new crop or variety might do well in both the interior and southcentral of Alaska or do better at one location compared to the other. These studies run for multiple years which helps take into account various factors like differences in the soil characteristics (each season’s trials are planted in ground that was fallow the previous season, so it gets moved around in the field) and seasonal weather differences (some years are hot and dry, others are cold and wet).
Every new crop or variety is evaluated as a potential “ideal” crop. “Ideal” crops germinate early in colder soils, head out or flower early, reach maturity early and are ready for harvest early with high yields and good quality seed. Almost every crop or variety tested over the years will have a seed yield, but if it isn’t of good quality, then it is not fully adapted for growing in Alaska. Or it might have high yields and good quality seeds once every three to five years but not consistently. These crops or varieties are considered “marginal” as they can still be grown with acceptable yields in Alaska. The poor quality product can be augmented with higher quality product from outside of Alaska. An example of a good but marginal crop species is bread wheat. There will be good yields and quality about once every five years. Poor quality seed results in poor quality flour because there weren’t enough of the right growing conditions during a season for the proteins to fully develop. Bread baked from this flour will be a small, dense loaf. However, the flour produced from this crop can be augmented with good-quality flour to make a superior loaf. How much to add will require some kitchen experimentation until the best ratio is found.
So, how do we go about evaluating new crops or varieties? This involves the collection of data in the field over the growing season and daily weather data at each location.
This field data includes :
- Planting date: this varies from season to season because the soil needs to be dry enough to get equipment in and yet moist enough to germinate the planted seed and activate the applied fertilizers.
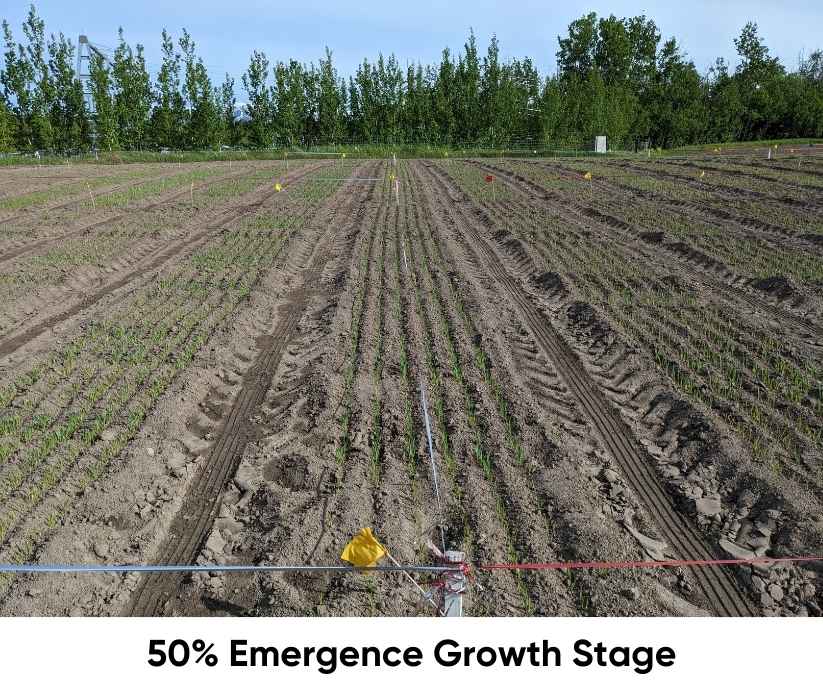
- The date of 50% emergence: when 50% or more of the planted crop has germinated and the seed leaves (called cotyledons) have emerged from the soil surface.
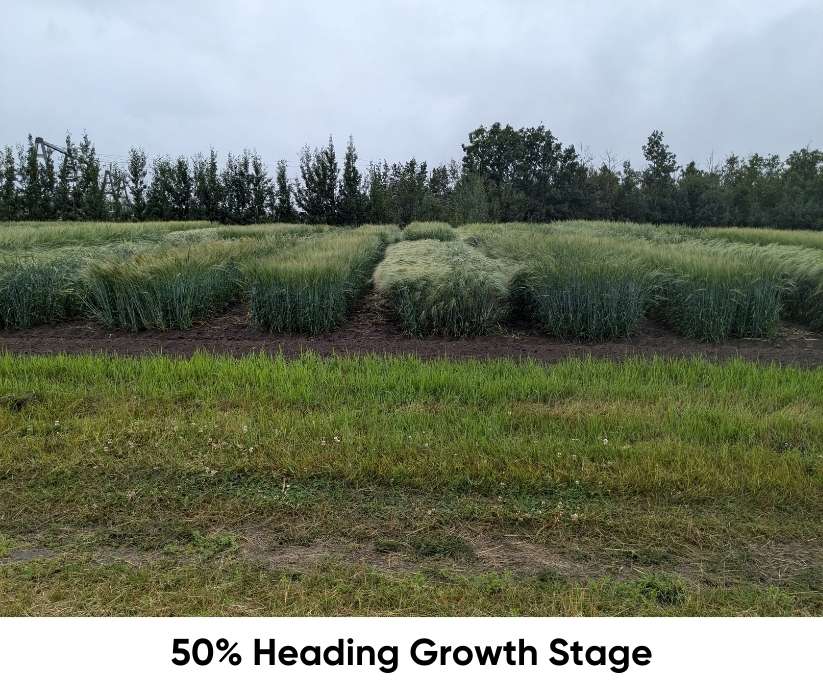
- The date of 50% heading/flowering: when 50% or more of the crop has the seed head fully emerged from the flag leaf on small grains and when 50% or more of an oilseed has reached full flowering. (The flag leaf is the last leaf to emerge on a flowering stalk)
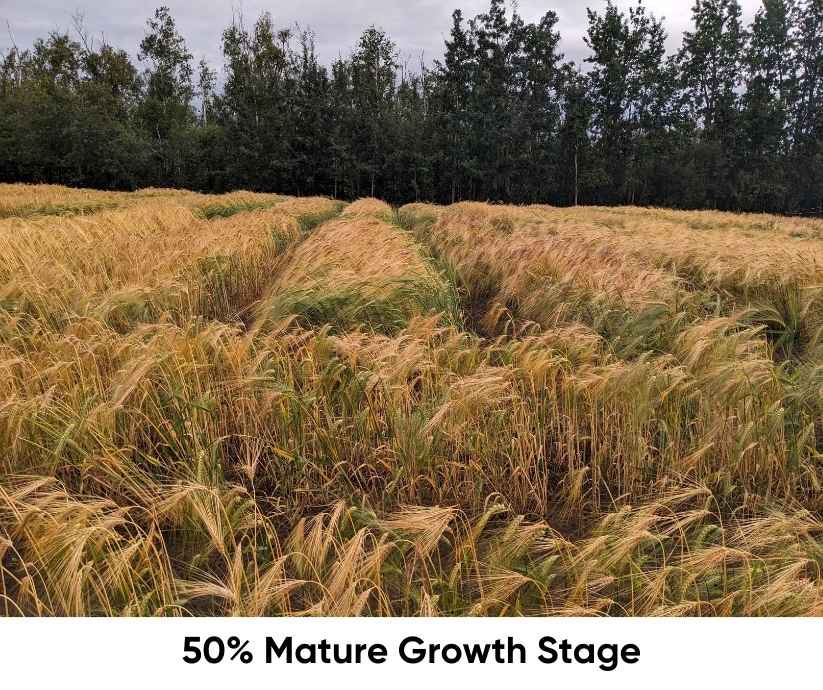
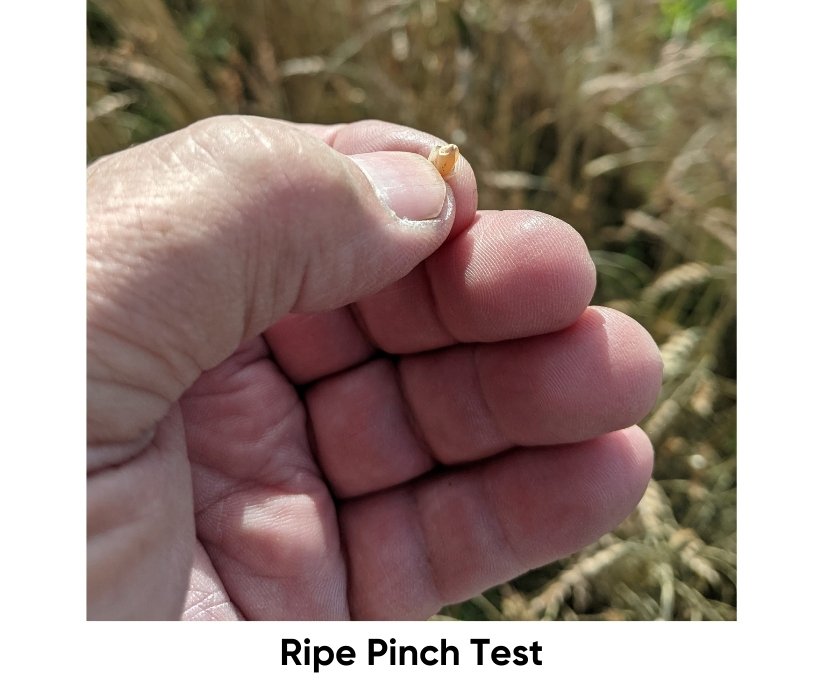
- The date of 50% maturity: when 50% or more of the crop has seed that, if given the right conditions (moisture and temperature) can germinate. The crop at this stage is not ripe enough to harvest yet as the grain kernels are only in a soft dough stage.
- The weekly percent crop cover: starting from planting date (0% Cover) to 50% maturity (100% Cover), this is a measure of how much of the plant biomass covers the bare soil when looking straight down.
- Estimated percent lodging at harvest: a visual estimation of how much of the crop has fallen over from vertical that might make the crop difficult to harvest and cause a loss in yields.
- Harvest date, seed yields (pounds/acre) and test weights (pounds/bushel)

Daily weather data at each location includes:
- Daily maximum and minimum air temperatures
- Daily precipitation and gains in soil moisture
- Daily pan evaporation and losses in soil moisture
- Soil moisture within a typical rooting depth of 0 – 12 inches at planting and then every week up to 50% maturity
The seasonal weather data is used in simple mathematical models to correlate with the plant’s physiological growth stages for each crop and variety over the current growing season. How much heat and soil moisture are needed over a growing season for any particular crop or variety to reach maturity? Crops or varieties that require too much heat or moisture to reach maturity will not be a good one for production in Alaska.
The calculated information from the current season’s weather data is also used to generate a long-term average over many years. This gives an indication of the climate over time at each location. Long-term climate data can be compared to the weather data for the current season. This is a quick way to see if changes in the climate over time at either location might be significant enough to make some of the marginal crops or varieties more viable for production in the Alaska environment. It must be noted here that there are much better climate models that use a lot of data inputs that are not used in these simple calculations.
When looking for a new crop or variety to grow in our gardens, one of the first things to look up is the number of days to a harvestable crop. The fewer the days, the better the likelihood of getting something to harvest in Alaska. This information is listed in the seed catalogs and on the back of each seed packet. While this is good information, the actual number of days can vary quite a bit. If we have a hot growing season, the number of days will be much shorter, a cool season will result in more days to harvest. To smooth out this variability, we use Growing Degree Days (GDD). A GDD is the average daily temperature minus a set low temperature at which plant growth stops, also called a base temperature. We use 32 degrees Fahrenheit.
GDD= [(Max Temp+ Min Temp)/2] – Base Temp
In this simple formula, the units of degrees Fahrenheit cancel out, so this term is often called “heat units.” Each day from the planting date to the harvest date will have calculated heat units. If the average temperature is below freezing, that number will be negative, if it’s, on average, above freezing, the number will be positive. The planting date is the starting point, and each succeeding day’s GDD value is added to make a set of values called cumulative GDD for the season.
The minimum temperature of 32 degrees (the point at which all plant growth stops) is used for all crops to compare them against ‘Otal’ feed barley (developed here at the Matanuska Experiment Farm and Extension Center), which will reach maturity and a ripe harvest almost every year at all locations in Alaska. Wheat should have a minimum temperature of 40 degrees and Polish canola, 28 degrees.
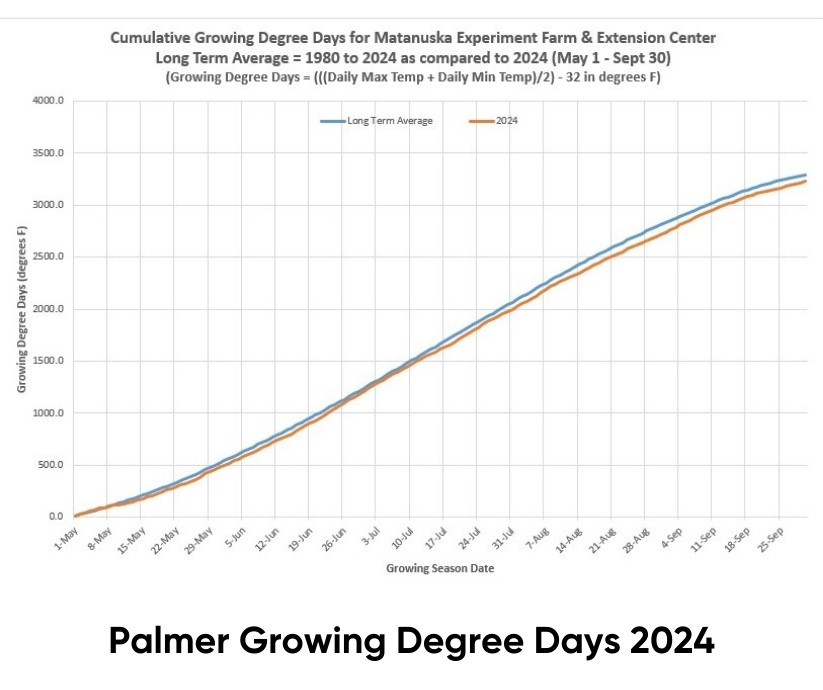
The number of cumulative GDD to reach each of the physiological growth stages are calculated for each crop and variety. For ‘Otal’ feed barley, the number of cumulative growing degree days to reach 50% emergence is around 90 GDD, for 50% heading about 600 GDD, and for 50% maturity around 1300 GDD. This will be true for any growing season and at any location regardless of the variation in planting date or seasonal weather patterns. This allows us to compare the standard variety of ‘Otal’ feed barley and any other new crop or variety. Check out the GDD graph for the Matanuska Experiment Farm and Extension Center for this season as compared with the long-term average. It shouldn’t come as much of a surprise that this growing season was cooler than the long-term average because it was cloudy and raining for much of the growing season. Crop growth slowed down and took longer to reach 50% maturity, even though the cumulative GDD to reach that point was pretty much the same as every season.
The daily precipitation (in inches) is used as a measure of the growing season weather for the crop being evaluated. WT date it rained is just as important as how much it rained that day. Precipitation recharges the soil moisture, so having frequent precipitation events of a moderate amount will be better for plant growth than having one big downpour on a single day.
A large amount of rain that falls over a short period will recharge the soil moisture within the typical rooting depth for agronomic crops of 12 inches. This water will flow downwards through large pores (between individual sand grains and soil aggregates) and stay in small pores (between silt, clay and organic matter).
The water that remains after it stops raining and moving downwards in the soil is called field capacity or the maximum water holding capacity. Plants will use this water for growth up to the wilting point (there will still be water in the small pores, but it doesn’t move fast enough to keep the plant alive). The seasonal patterns of precipitation events, in addition to cumulative precipitation over the growing season, are important in determining the adaptability of any crop or variety to be grown without irrigation.
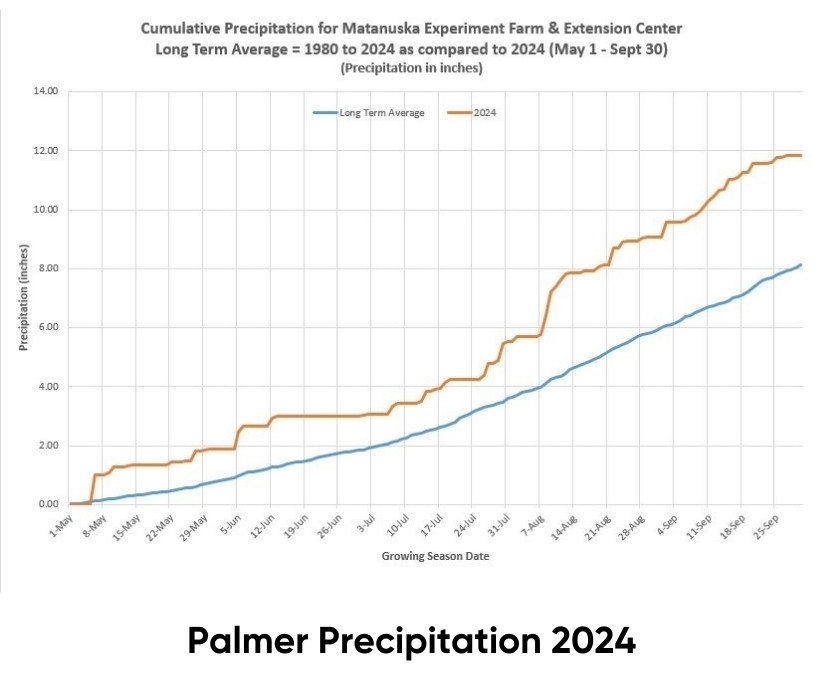
In the graph you can see we had way more cumulative precipitation this season than the long-term average, because it was cloudy and raining for much of the growing season. The daily precipitation events were spread out and usually of smaller amounts all season, which helps to explain the next calculation.
Tied in with the precipitation (gains to soil moisture) is the daily evaporation (losses to soil moisture). Evaporation is measured from an open pan of water (an “evap tank”). The daily evaporation is called Potential Evapotranspiration (PET). Water from an open pan is evaporating at a different rate than water evaporation from the soil surface and transpiration from plant leaves, so PET needs to be converted into Actual Evapotranspiration (AET).
Fortunately, there is a linear correlation between PET and AET. With no crops (0% plant cover), AET is 30% of PET and at complete cover (100% plant cover), AET is 85% of PET. The relationship is a straight line between these two points. The percent plant cover changes as the crop grows, so the percent AET also changes. A crop cover measure is taken every week from planting (0% cover) to 50% maturity (100% cover).
The percent cover here in Alaska is fairly consistent despite changes in planting date so the AET values can also be used to determine the soil water balance, which accounts for water inputs and outputs.
Soil Water Balance (daily) = Inputs (daily precipitation) – Outputs (daily AET)
On May 1 the soil should be at maximum water holding capacity from snowmelt (field capacity) for the typical rooting depth of 12 inches. The daily calculation is either added if precipitation is greater than AET or subtracted if AET is greater than precipitation. Any excess soil water in the top 12 inches moves downward to recharge the soil moisture storage at depth. Any losses as evapotranspiration will dry out the soil moisture in the rooting depth. The soil in the rooting depth can reach wilting point or below with dry weather, but soil moisture at depth can move up to maintain plant growth over time (assuming a uniform soil texture at depth). The water balance calculation is used to determine if irrigation might be needed for higher-value crops in areas where soil texture and thus soil moisture might be limiting early in the growing season.
At the Fairbanks Experiment Farm, there is always sufficient soil moisture at depth to keep plant physiological function going for decent yields and quality in the typical drought conditions that occur during the mid- to late growing season. This is because the soil has a uniform texture and structure to great depths. The soil moisture below the rooting depth will move upwards quickly enough to the drier soil within the rooting depth to maintain plant growth.
In areas where the soil texture is shallow (silt loams over sands and gravels) like here at the Matanuska Experiment Farm and Extension Center, crops can suffer in drought conditions. Any excess soil moisture to saturated conditions (all the large and small pores are filled with water) will be lost in the sands and gravels below the rooting depth. When the soil in the rooting depth dries out from evapotranspiration, the water in the sands and gravels can’t move back up because the soil pores are too large. Crop growth will suffer in yields and quality unless there is sufficient precipitation.
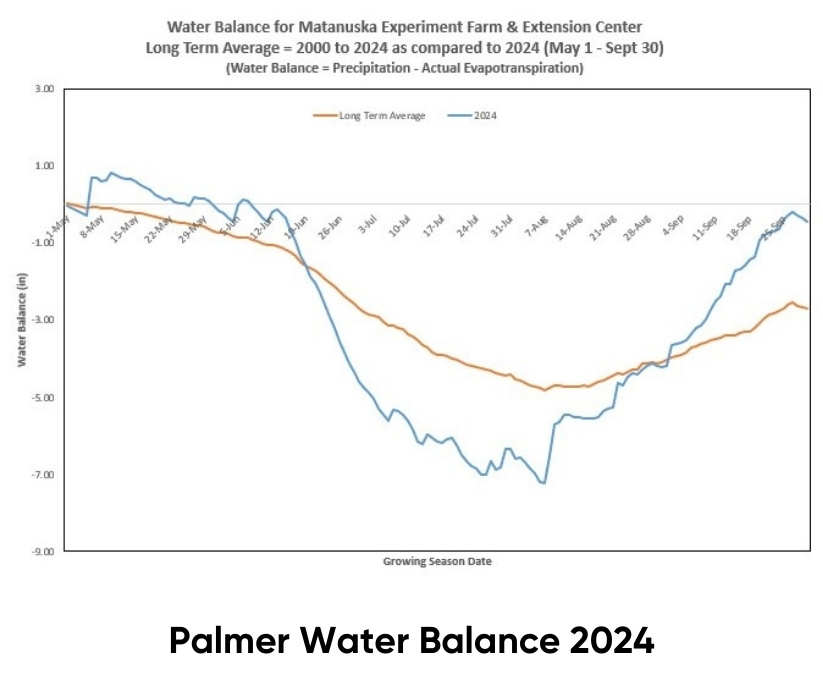
In the graph of the water balance for Matanuska Experiment Farm and Extension Center you’ll see that this growing season and the long- term average showed a soil moisture deficit for much of the growing season. Yet, none of the crops showed any moisture stress. What happened? The precipitation events occurred often enough and at low enough amounts during the growing season to keep the upper 6 inches of the rooting depth at or above field capacity. They were not always large enough to keep an entire rooting depth of 12 inches at field capacity for the entire growing season, which is the assumption of the model’s calculations (a good reason to always question the assumptions of all weather and climate models).
The result of this type of seasonal precipitation leads to very shallow root development for annual agronomic crops, which in turn leads to weaker stem-to-root plant development, and more lodging (falling over), thus fewer harvestable seeds and greater predation by migratory sandhill cranes. In addition, a lodged crop increases the relative humidity within the plant biomass which can result in fungal diseases and more germination of seed while still in the heads. Both of which cause lower seed harvest and lower seed quality at harvest. In other words, it was a lousy year for agronomic crop variety trials.
Bob Van Veldhuizen, Agronomy Research Assistant
